Mastering Candlestick Patterns for Binary Options Trading
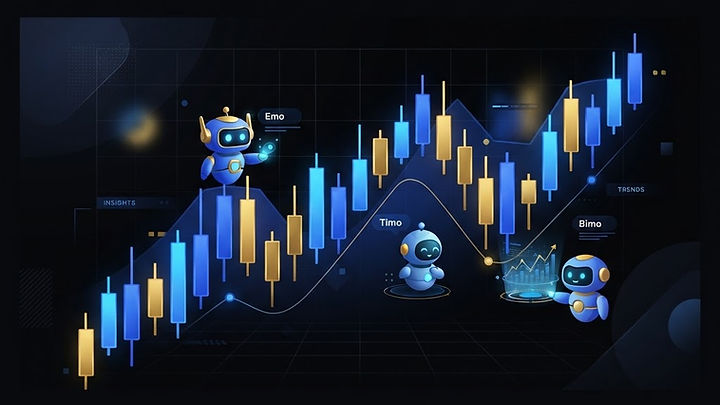
Candlestick patterns for binary options are visual representations of price action that help traders identify potential market reversals or continuations. By analyzing these formations on 2x option charts, traders can better interpret market sentiment and refine their entry timing, though these patterns should always be used alongside robust risk management.
Understanding Candlestick Patterns for Binary Options
Candlestick patterns for binary options serve as a foundational element of technical analysis. By visualizing the open, high, low, and close prices of an asset over a specific timeframe, these charts provide a clear picture of market psychology. When you trade on 2x option, you can access various chart types, including candlesticks, which allow you to observe the tug-of-war between buyers and sellers. Unlike simple line charts, candlesticks reveal the intensity of price movements, helping you identify potential turning points in synthetic markets like currencies, crypto, and commodities.
To effectively use these patterns, you must first understand that they are not crystal balls. They are tools that indicate the probability of a price movement based on historical data. Whether you are using the platform on a desktop or a phone browser, the ability to read these signals is a skill that develops with practice. Many traders start by exploring the Best Binary Options Strategy for Beginners: A Practical Guide to understand how these visual cues fit into a broader trading plan. Remember that market availability and legality depend on your specific country, so always ensure you are operating within your local regulations.
How Do Candlestick Patterns Work on 2x option?
On the 2x option platform, you can customize your workspace with various drawing tools and indicators such as SMA, EMA, RSI, MACD, and Bollinger Bands. When you combine these indicators with candlestick analysis, you create a multi-layered approach to the market. For instance, a reversal pattern appearing at a key support or resistance level identified by a Bollinger Band can provide a stronger signal than a pattern appearing in isolation.
It is essential to remember that 2x option offers a Demo account with virtual funds, which is the ideal environment to test these combinations. By practicing in the Demo account, you can observe how different patterns behave without using your real capital. Once you feel confident, you can transition to a Real account. Always keep in mind that payouts are locked when the trade is placed, ranging between 55% and 93%, so your entry timing—often dictated by the completion of a candlestick—is critical to your potential outcome.
Key Reversal Patterns to Watch
Reversal patterns are among the most sought-after signals because they suggest that the current trend is losing momentum. A classic example is the 'Hammer' pattern, which features a small body and a long lower wick, indicating that sellers pushed the price down but buyers successfully reclaimed the level. Another common formation is the 'Engulfing' pattern, where a larger candle completely 'swallows' the previous one, signaling a potential shift in sentiment.
When identifying these, look for confluence. A pattern is generally considered more reliable if it aligns with a trend line or a significant price level. You can learn more about managing the risks associated with these trades by reading our Essential Binary Options Risk Management Rules for Traders. Because 2x option provides live payouts per asset, you can quickly assess if the potential reward justifies the risk of the trade. Always verify the asset's current payout before committing to a position, as these are updated live.
Comparing Chart Analysis Tools
To help you decide which tools to use, the following table compares the common analytical features available on the 2x option platform:
| Feature | Purpose | Best Used For |
|---|---|---|
| Candlesticks | Price Action | Identifying reversals and trends |
| Heikin Ashi | Trend Smoothing | Filtering out market noise |
| RSI Indicator | Momentum | Spotting overbought/oversold conditions |
| Bollinger Bands | Volatility | Identifying potential breakouts |
| Drawing Tools | Support/Resistance | Defining entry and exit zones |
By utilizing these tools in tandem, you can build a more comprehensive strategy. For those interested in how news events impact these patterns, our Binary Options News Trading Strategy Guide for 2x option offers further insights into combining technical and fundamental analysis.
Steps to Implement a Candlestick Strategy
If you are ready to start applying these concepts, follow this structured approach to ensure you are trading methodically:
- Open your chart on the Trade page and select the candlestick view.
- Choose an asset and check the current payout percentage.
- Identify a clear trend using indicators like the SMA or EMA.
- Wait for a recognizable candlestick pattern to form at a support or resistance level.
- Use your Demo account to execute a practice trade based on the signal.
- Record your results in a log, as detailed in How to Journal Binary Options Trades: A Guide for 2x option.
- Review your performance and adjust your strategy as needed.
This disciplined process helps remove emotional decision-making, which is a common pitfall for new traders. You can also consult the Help center if you need assistance with platform features or wish to use the AI help assistant.
The Role of AI and Support in Your Trading
2x option provides optional AI trading assistants (labeled AI) to help you analyze market data. While these tools can assist in identifying patterns, they do not guarantee results. It is important to maintain your own analytical skills rather than relying solely on automated suggestions. If you encounter difficulties or have questions about how a specific pattern is calculated, you can reach out via human support tickets in the Help Center.
Furthermore, the platform features a 10-level Rewards program that offers bonuses based on your turnover. As you progress through these levels, ensure that you understand the conditions associated with any bonuses you receive. Always prioritize your education and risk management over chasing bonuses. For more information on how to test your strategies effectively, check out Binary Options Demo Account Strategy Testing: A Practical Guide.
Managing Your Account and Withdrawals
Trading is not just about finding the right pattern; it is also about managing your funds. 2x option accepts deposits via card and crypto. When you are ready to access your funds, remember that withdrawals are reviewed manually by the team. You will need an email code to initiate the process, and the team may request identity verification to ensure the security of your account.
Always keep your account information secure and review the Privacy and Terms pages to understand your rights and responsibilities. If you ever feel that your trading is becoming overwhelming, take a break and revisit the Risk Disclosure to remind yourself of the inherent nature of market speculation. By maintaining a balanced approach, you can focus on the long-term goal of improving your trading skills rather than short-term outcomes. Try the Demo account to begin your journey today.
Practice with virtual funds before risking real money.
Try the Demo accountFAQ
Sources
Risk warning: Trading carries a high level of risk. You may lose all your capital. 18+ only. Not financial advice. Availability depends on your country.
Spotted a mistake? Tell us and we will correct it.