How to Read Binary Options Charts: A Beginner's Guide

Learning how to read binary options charts involves understanding price action through various chart types like candlesticks and Heikin Ashi. By utilizing technical indicators such as RSI, MACD, and Bollinger Bands, traders can identify trends and potential market reversals to make more informed decisions on the 2x option platform.
How to Read Binary Options Charts Effectively
Learning how to read binary options charts is the foundational skill for any trader looking to navigate the markets with clarity. Whether you are using a Demo account to practice or executing trades on a Real account, the chart is your primary source of information. It acts as a visual language, translating complex market movements into patterns that you can analyze. On the 2x option platform, you have access to a variety of tools designed to help you interpret these movements, including candlesticks, Heikin Ashi, line, and area charts. Understanding these visual representations allows you to see the battle between buyers and sellers in real-time, which is essential before you decide to trade.
To begin, you must understand that charts represent the price history of OTC synthetic markets, including currencies, crypto, and commodities. Because these assets are synthetic, they provide unique opportunities for analysis. When you open your chart, you are looking at the historical price action of an asset, which can help you identify whether the market is trending upward, downward, or moving sideways. By mastering the basics of technical analysis for binary options trading, you move away from guessing and toward a more systematic approach. Remember that the availability and legality of these services depend on your country of residence, so always ensure you are operating within your local regulations.
What Are the Different Types of Charts Available?
Choosing the right chart type is the first step in your analysis. Each type offers a different perspective on price movement. On 2x option, you can switch between several views to suit your strategy:
| Chart Type | Best Used For | Key Feature |
|---|---|---|
| Candlestick | Detailed price action | Shows Open, High, Low, Close |
| Heikin Ashi | Trend smoothing | Reduces noise in volatile markets |
| Line | Long-term trends | Connects closing prices simply |
| Area | Visualizing momentum | Fills the space below the price line |
Candlestick charts are widely considered the industry standard because they provide the most information in a single glance. Each candle represents a specific timeframe, showing you the opening and closing prices, as well as the highest and lowest points reached during that period. If you are new to this, consider using a Demo account to toggle between these views without using real funds. By observing how different charts display the same price data, you will quickly learn which style aligns best with your personal trading preferences and helps you spot patterns more efficiently.
How Do You Use Indicators to Improve Analysis?
Indicators are mathematical calculations plotted on your chart that help you filter out market noise and identify potential entry points. The 2x option platform provides a robust suite of indicators, including SMA (Simple Moving Average), EMA (Exponential Moving Average), RSI (Relative Strength Index), MACD (Moving Average Convergence Divergence), and Bollinger Bands. These tools are not magic; they are aids that help you confirm what the price action is already suggesting. For example, the RSI is often used to identify overbought or oversold conditions, which might signal a potential reversal in the asset's price.
When using indicators, it is important to avoid "analysis paralysis" by cluttering your screen with too many tools. A common mistake beginners make is adding every available indicator to their chart, which can lead to conflicting signals. Instead, pick two or three that complement each other. For instance, you might use an EMA to determine the overall trend direction and an RSI to find the best moment to enter a trade. As you refine your skills, you will learn that indicators are most effective when combined with a solid understanding of support and resistance levels. You can find more information on how to avoid common pitfalls in binary options trading by visiting our educational resources.
How to Identify Trends and Market Structure?
Identifying the trend is perhaps the most critical part of learning how to read binary options charts. A market is generally in one of three states: an uptrend, a downtrend, or a sideways (consolidation) phase. In an uptrend, the price consistently makes higher highs and higher lows. Conversely, a downtrend is characterized by lower highs and lower lows. When the price moves horizontally, it indicates that the market is in a period of indecision, often referred to as consolidation.
To identify these structures, look at the broader timeframe first. Zooming out allows you to see the "big picture" before you focus on the short-term movements that affect your immediate expiry. Many traders use drawing tools available on the 2x option platform to mark these trendlines directly on the chart. By connecting the lows in an uptrend or the highs in a downtrend, you create a visual boundary that can help you anticipate where the price might bounce or break. Understanding these structures is vital, as it helps you decide whether to place a Call or a Put option. For a deeper dive into these mechanics, read our guide on binary options call vs put explained.
What Is the Step-by-Step Process for Chart Analysis?
Following a consistent routine helps remove emotion from your trading decisions. Here is a simple, step-by-step approach to analyzing your charts before placing a trade:
- Select Your Asset: Choose the currency, crypto, or commodity you wish to trade and check the live payout percentage.
- Set the Timeframe: Choose a chart interval (e.g., 1-minute or 5-minute) that matches your intended expiry time.
- Identify the Trend: Use trendlines or moving averages to determine if the market is moving up, down, or sideways.
- Check for Key Levels: Identify historical support (where price has stopped falling) and resistance (where price has stopped rising).
- Apply Indicators: Add your chosen indicators to confirm the trend or look for overbought/oversold signals.
- Wait for Confirmation: Look for a specific candlestick pattern or indicator signal before executing your trade.
By following this process, you ensure that every trade is based on a logical assessment of the market rather than a gut feeling. If you are just starting, you can practice binary options without real money using our virtual funds feature to build your confidence. Always remember that payouts are locked when the trade is placed, so your analysis must be completed before you commit your capital.
How Do You Manage Risk While Reading Charts?
Even the best chart analysis cannot predict the future with certainty. Risk management is the safety net that protects your account balance. One of the most important rules is to never trade more than a small percentage of your total capital on a single position. Because 2x option offers a wide range of payouts between 55% and 93%, it is tempting to chase higher returns, but you must balance this with the probability of the trade succeeding. Always check the Risk Disclosure to understand the nature of these financial instruments.
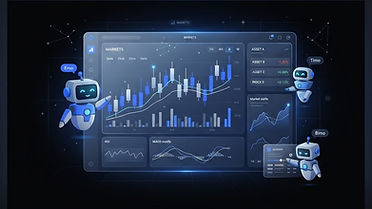
Furthermore, be aware of the tools at your disposal. While the platform offers optional AI trading assistants like Emo, Timo, and Bimo, these are clearly labeled as AI and do not guarantee results. They should be used as supplementary tools, not as a replacement for your own analysis. If you ever feel overwhelmed, our Help Center is available, featuring an AI help assistant and the ability to submit human support tickets. Remember that successful trading is a marathon, not a sprint. By maintaining a disciplined approach to your chart reading and risk management, you position yourself to make more consistent decisions over time. If you are ready to start your journey, you can Try the Demo account.
How to Stay Informed and Avoid Scams?
In the world of online trading, education is your best defense. Always ensure you are using a reputable platform and be wary of any service that promises "guaranteed" profits or "risk-free" trading. Legitimate platforms like 2x option provide transparent information about their features, such as the Rewards program, deposit methods via card or crypto, and the manual withdrawal process that requires email verification. You can learn more about identifying potential issues in our guide on how to identify binary options scams.
For further learning, many authoritative sources provide excellent educational materials on technical analysis. Organizations like the U.S. Securities and Exchange Commission (SEC) offer guidance on understanding the risks associated with binary options. Additionally, Investopedia provides comprehensive definitions of financial terms that can help you expand your vocabulary. By staying informed and continuously practicing your chart-reading skills, you can navigate the markets with greater confidence. Always keep your account secure, utilize the available Privacy settings, and review the Terms of service regularly to stay updated on platform features and policies.
Practice with virtual funds before risking real money.
Try the Demo accountFAQ
Sources
Risk warning: Trading carries a high level of risk. You may lose all your capital. 18+ only. Not financial advice. Availability depends on your country.
Spotted a mistake? Tell us and we will correct it.