Technical Analysis for Binary Options Trading: A Complete Guide

Technical analysis for binary options trading involves using historical price data, chart patterns, and mathematical indicators to forecast potential market movements. By analyzing trends and volatility on 2x option, traders aim to make informed decisions regarding call or put options based on objective data rather than speculation.
What is Technical Analysis for Binary Options Trading?
Technical analysis for binary options trading is the practice of evaluating market data to identify potential price trends and reversals. Unlike fundamental analysis, which focuses on economic news, technical analysis relies entirely on historical price action and volume. When you trade on 2x option, you are interacting with OTC synthetic markets for currencies, crypto, and commodities. Because these assets behave according to supply and demand, their price movements often leave patterns that traders can study. By using the tools available on the platform, you can attempt to spot these repetitive behaviors to inform your strategy. It is important to remember that market conditions vary, and availability depends on your country of residence. Before diving into live markets, you can explore how to practice binary options without real money using the platform's virtual funds. Understanding the basics of binary options call vs put is the first step toward applying these analytical techniques effectively.
Which Chart Types Should You Use on 2x Option?
Visualizing price movement is the foundation of any analytical approach. 2x option provides several chart types to help you interpret market sentiment. Candlestick charts are widely favored because they display the open, high, low, and close prices for a specific timeframe, offering more detail than simple line charts. Heikin Ashi charts are also available, which can help smooth out price noise to make trends easier to identify. For those who prefer a cleaner view, line and area charts are useful for spotting long-term price levels. You can access these tools directly on the Trade page. When choosing a chart type, consider your trading style; scalpers often prefer the granular detail of candlesticks, while trend followers might find line charts sufficient for identifying major support and resistance levels. Always ensure you are aware of the common pitfalls in binary options trading before committing to a specific charting style, as relying on a single view can sometimes lead to incomplete market analysis.
How Do Technical Indicators Improve Your Trading?
Technical indicators are mathematical calculations applied to price data that help confirm trends or signal potential reversals. On 2x option, you have access to a suite of indicators including SMA (Simple Moving Average), EMA (Exponential Moving Average), RSI (Relative Strength Index), MACD (Moving Average Convergence Divergence), and Bollinger Bands. These tools act as filters for your trading decisions. For example, an RSI reading above 70 might suggest an asset is overbought, while a reading below 30 could indicate it is oversold. Bollinger Bands help you visualize volatility; when the bands widen, it often indicates increased market activity. According to Investopedia's guide on technical analysis, these indicators are most effective when used in combination rather than in isolation. By layering an oscillator like the MACD with a trend indicator like the SMA, you can create a more robust framework for your trades. Remember that no indicator is perfect, and they should be used to support your overall strategy rather than as a standalone signal for success.
How to Perform Multi-Timeframe Analysis?
One of the most effective ways to refine your technical analysis is through multi-timeframe analysis. This involves looking at a longer timeframe to determine the primary trend and a shorter timeframe to find an entry point. For instance, you might check the trend on a 1-hour chart and then zoom into a 5-minute chart to place your trade. This method helps you avoid trading against the major market momentum. On 2x option, you can easily switch between different time intervals to gain this perspective. When you identify a trend on a larger scale, you are essentially aligning yourself with the broader market sentiment. This approach is often discussed in educational resources from financial regulators, which emphasize the importance of understanding market context. By combining this with the Rewards program, you can manage your trading journey with a structured approach. Always verify your identity if required and ensure you understand the terms of the platform before you deposit funds to trade.
Comparison of Common Technical Indicators
| Indicator | Primary Use | Best For |
|---|---|---|
| SMA/EMA | Trend Direction | Identifying long-term momentum |
| RSI | Momentum | Spotting overbought/oversold conditions |
| MACD | Trend/Momentum | Confirming trend reversals |
| Bollinger Bands | Volatility | Identifying potential breakouts |
How to Build a Technical Analysis Routine?
Developing a consistent routine is essential for any trader. Follow these steps to integrate technical analysis into your daily practice:
- Open the Trade interface and select your preferred asset (currency, crypto, or commodity).
- Set your chart to your preferred type (e.g., candlesticks) and choose a timeframe.
- Apply 2-3 indicators, such as an SMA for trend and RSI for momentum.
- Analyze the chart for patterns like support and resistance levels.
- Check the live payout percentage, which is locked when you place the trade.
- Execute your trade based on your analysis, ensuring you have a clear plan for your expiry time.
If you are unsure about the legality of these activities in your region, consult local laws, as binary options trading regulation varies globally. You can also use the Help center or the AI assistant to clarify platform features. If you ever feel overwhelmed, remember that you can always return to the Demo account to refine your skills without using real capital.
How to Manage Risk While Using Technical Analysis?
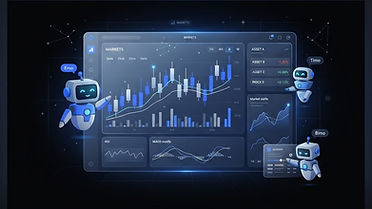
Technical analysis is a tool for probability, not a guarantee of results. Even with the best indicators, markets can be unpredictable. Risk management is the most critical component of your trading plan. Never trade more than you can afford to lose, and always be aware of the risk disclosure provided by the platform. When using AI trading assistants like Emo, Timo, or Bimo, remember that these are tools and do not guarantee success. Always verify the information provided by these assistants. Furthermore, be cautious of binary options scams that promise high returns with little effort. A disciplined trader focuses on consistent processes rather than individual trade outcomes. If you need to access your funds, the withdraw process is straightforward, though it involves manual review and may require identity verification. By maintaining a professional mindset and using the platform's tools responsibly, you can better navigate the complexities of the market. Always prioritize your education and stay updated on binary options vs forex trading to understand the differences in market structure. Try the Demo account to get started.
Practice with virtual funds before risking real money.
Try the Demo accountFAQ
Sources
Risk warning: Trading carries a high level of risk. You may lose all your capital. 18+ only. Not financial advice. Availability depends on your country.
Spotted a mistake? Tell us and we will correct it.