Binary Options Indicators for Beginners: A Practical Guide
By 2x option Editorial TeamAI-assisted, reviewed29 Oct 2026 · 6 min read

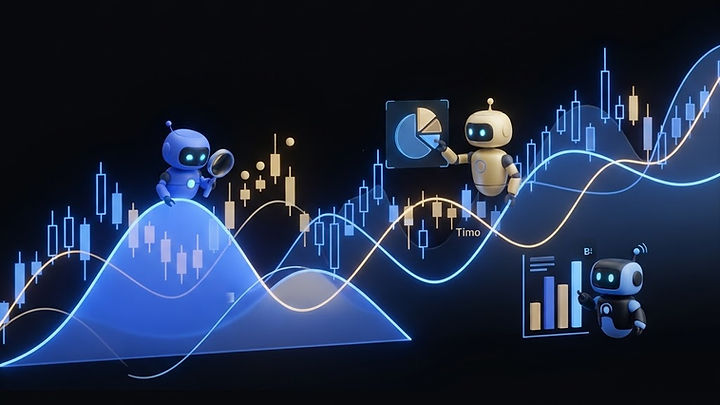
Binary options indicators for beginners are mathematical tools used to analyze historical price data on charts. By identifying trends and momentum, these indicators help traders make more informed decisions. On 2x option, you can access tools like SMA, EMA, RSI, MACD, and Bollinger Bands to support your technical analysis.
What are binary options indicators for beginners? Technical indicators are mathematical calculations applied to historical price data, designed to help traders identify potential market trends and momentum. For those new to the field, these tools act as a compass, providing visual cues on a chart that might otherwise look like random noise. On the 2x option platform, you can access a variety of these tools, including Simple Moving Averages (SMA), Exponential Moving Averages (EMA), the Relative Strength Index (RSI), the Moving Average Convergence Divergence (MACD), and Bollinger Bands. These indicators are essential for anyone looking to move beyond guesswork and into a more structured approach to trading. It is important to remember that availability and legality of these services depend on your country of residence. Before diving into complex strategies, it is helpful to understand the basics of Binary Options Trading Explained: A Beginner's Guide. By using these indicators, you are essentially looking at past performance to gauge potential future movements, though no tool can predict the market with certainty. Whether you are using a desktop or a phone browser, the 2x option interface allows you to overlay these indicators directly onto your charts, helping you visualize the market environment before you place a trade. Always remember that trading involves risk, and you should consult our Binary Options Risk Management Strategies: A Practical Guide to protect your capital. ## How do you choose the right indicators for your strategy? Choosing the right indicators is a personal process that depends on your trading style and the assets you prefer. 2x option provides a diverse range of assets, including OTC synthetic markets for currencies, crypto, and commodities. Because these are synthetic markets, technical analysis is often the primary way traders attempt to find patterns. When selecting indicators, consider whether you are looking for trend direction or market momentum. For instance, moving averages like SMA and EMA are excellent for identifying the general direction of an asset, while oscillators like the RSI are better suited for spotting potential reversal points. Many beginners make the mistake of cluttering their charts with too many indicators, which can lead to conflicting signals. A cleaner chart is often more effective. If you are just starting, you might want to read about Common Mistakes in Binary Options Trading: A Guide for Beginners to avoid common pitfalls. Remember that 2x option offers a Demo account with virtual funds, which is the perfect environment to test different indicator combinations without using your real capital. By practicing in the Demo account, you can see how different tools react to market changes and determine which ones align best with your personal risk tolerance and goals. ## How to set up your chart for technical analysis? Setting up your workspace is a critical step in your trading journey. On 2x option, you can customize your view to suit your needs. Start by selecting your preferred chart type—whether it is candlesticks, Heikin Ashi, line, or area charts. Candlesticks are particularly popular because they provide a wealth of information about price action within a specific timeframe. Once your chart type is set, you can begin adding indicators. To add an indicator, navigate to the tools menu on the platform. You might start by adding an SMA to smooth out price fluctuations, followed by an RSI to gauge momentum. If you are interested in volatility, Bollinger Bands are a great addition. The platform also provides various drawing tools that allow you to mark support and resistance levels manually. For those looking to expand their knowledge, our Best Educational Resources for Binary Trading: A Complete Guide offers further insights into mastering these tools. Remember that payouts on 2x option are shown live per asset, ranging between 55% and 93%, and are locked once you place your trade. Having a clear, organized chart helps you make these decisions with more confidence. If you need assistance, the Help Center features an AI help assistant and human support tickets to guide you through the setup process. ## Can you combine multiple indicators for better results? Relying on a single indicator is rarely enough to form a complete picture of the market. Experienced traders often look for "confluence," which occurs when multiple indicators provide the same signal. For example, if an asset is showing an oversold condition on the RSI and is simultaneously touching a lower Bollinger Band, some traders might view this as a stronger signal than if either indicator were acting alone. This concept of confluence is a cornerstone of technical analysis. However, it is vital to understand that even with multiple indicators, there is no guarantee of success. According to resources like Investopedia, indicators are lagging tools, meaning they are based on past data and cannot predict the future with certainty. When using indicators on 2x option, keep in mind that you can also utilize optional AI trading assistants like Emo, Timo, or Bimo. These are clearly labeled as AI and are designed to assist your analysis, but they do not guarantee results. Always maintain a disciplined approach and never trade with money you cannot afford to lose. If you are curious about how these tools differ from other markets, check out Binary Options vs Forex Trading Differences: A Complete Guide. ## Comparison of common technical indicators | Indicator | Primary Use | Best For | | :--- | :--- | :--- | | SMA/EMA | Trend Identification | Determining market direction | | RSI | Momentum | Identifying overbought/oversold levels | | MACD | Trend & Momentum | Timing entry and exit points | | Bollinger Bands | Volatility | Spotting potential breakouts | ## How to practice using indicators safely? The most effective way to learn is through consistent practice. 2x option provides a Demo account that allows you to trade with virtual funds. This is an invaluable resource for beginners. You can test how different indicators perform during various market conditions without the pressure of losing real money. When you feel ready to transition to a Real account, you can deposit funds using a card or crypto. Remember that withdrawals are reviewed manually by the team and may require identity verification, so ensure your account details are accurate. As you practice, keep a trading journal to record which indicators you used, why you entered the trade, and the outcome. This will help you identify what works for you and what does not. If you find yourself struggling, do not hesitate to use the Help section or reach out to support. Additionally, the 2x option Rewards program offers a 10-level structure that provides bonuses with specific turnover conditions, which can be an interesting aspect of your trading journey. Always prioritize your education and risk management over the desire for quick results. By taking the time to understand the mechanics of the market, you are building a foundation that will serve you far better in the long run than any single "magic" indicator ever could. ## Steps to start trading with indicators 1. Open a Demo account to access the platform with virtual funds. 2. Select an asset from the available OTC synthetic markets. 3. Open the chart settings and choose your preferred chart type (e.g., candlesticks). 4. Add your chosen indicators (e.g., RSI or SMA) from the tools menu. 5. Observe how the indicators react to price movements over time. 6. Develop a simple strategy based on your observations. 7. When you feel confident, consider switching to a Real account. 8. Always manage your risk and follow the Terms of the platform. Try the Demo account at /.
Practice with virtual funds before risking real money.
Try the Demo accountFAQ
Sources
Risk warning: Trading carries a high level of risk. You may lose all your capital. 18+ only. Not financial advice. Availability depends on your country.
Spotted a mistake? Tell us and we will correct it.