How to Read Binary Options Technical Charts: A Beginner's Guide
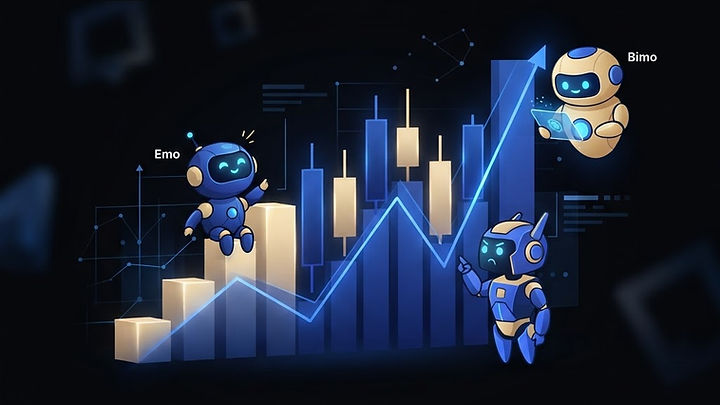
Reading binary options technical charts involves interpreting price action through candlestick patterns and indicators like RSI or MACD. By analyzing trends and support levels on the 2x option platform, traders can make informed decisions. Always practice with virtual funds before trading on a Real account to build your skills.
Understanding the Basics of Technical Charts
Learning how to read binary options technical charts is a fundamental skill for any trader looking to navigate synthetic markets. At its core, technical analysis is the study of historical price movements to forecast potential future directions. On the 2x option platform, you have access to a variety of chart types, including candlesticks, Heikin Ashi, line, and area charts. Each provides a different perspective on market activity. Candlestick charts are particularly popular because they display the open, high, low, and close prices for a specific timeframe, offering a clear visual representation of market sentiment. Whether you are trading currencies, crypto, or commodities, understanding these visual cues is the first step toward structured analysis. Before diving into live markets, it is highly recommended to explore these tools using the Demo account, which allows you to practice with virtual funds without the pressure of using your own capital. Remember that market availability and legality depend on your specific country of residence.
How Do Candlestick Patterns Work?
Candlesticks are the building blocks of modern technical analysis. A single candle represents price movement over a set period. A green candle typically indicates that the price closed higher than it opened, suggesting bullish momentum, while a red candle shows the price closed lower, indicating bearish pressure. The "wicks" or "shadows" extending from the body of the candle show the extreme high and low prices reached during that interval. By observing these patterns, you can identify potential reversals or trend continuations. For those new to this, reading Binary Options Indicators for Beginners: A Practical Guide can provide deeper insights into how these patterns interact with market volatility. When you feel ready to apply your knowledge, you can Trade on the platform using either your virtual balance or a Real account. Always ensure you are familiar with the Risk Disclosure before committing funds, as trading involves significant uncertainty.
Which Indicators Should You Use?
Indicators are mathematical calculations plotted on your chart to help filter out market noise. The 2x option platform supports several essential tools, including Simple Moving Averages (SMA), Exponential Moving Averages (EMA), the Relative Strength Index (RSI), MACD, and Bollinger Bands. For instance, an SMA helps smooth out price data to identify the direction of a trend, while the RSI measures momentum to highlight overbought or oversold conditions. According to Investopedia, technical analysis is a tool used to evaluate investments and identify trading opportunities by analyzing statistical trends. Combining these indicators can help you build a more robust strategy. However, no indicator is perfect. It is vital to learn Binary Options Risk Management Strategies: A Practical Guide to protect your capital. You can also consult the Help center, which features an AI assistant to answer your technical questions, or reach out to human support for more complex inquiries.
How to Identify Support and Resistance Levels
Support and resistance are key concepts in technical analysis. Support is a price level where a downtrend tends to pause due to a concentration of demand, while resistance is a level where an uptrend tends to pause due to a concentration of supply. Identifying these zones allows you to anticipate where the price might bounce or break through. You can use the drawing tools available on the 2x option interface to mark these levels directly on your chart. When the price approaches a support level, some traders look for signs of a reversal to place a trade. Conversely, when it hits resistance, they might look for a downward move. Mastering these levels is essential for anyone learning How to Choose a Reliable Binary Options Broker: A Guide. By practicing these techniques, you gain a better understanding of market structure, which is crucial for long-term development.
Comparing Charting Tools and Their Uses
Choosing the right tool depends on your trading style and the assets you are monitoring. Below is a comparison of common technical tools available on the platform:
| Tool Type | Primary Function | Best For |
|---|---|---|
| Candlesticks | Price action visualization | Identifying patterns |
| SMA/EMA | Trend direction | Following market momentum |
| RSI | Momentum measurement | Spotting overbought/oversold |
| Bollinger Bands | Volatility tracking | Identifying breakouts |
As shown in the table, each tool serves a specific purpose. While RSI helps you see if an asset is overextended, Bollinger Bands help you visualize how much the price is deviating from its average. You can experiment with these on the Demo account to see which combination fits your personal style. Remember that payouts on the platform are shown live per asset, ranging between 55% and 93%, and are locked once you place your trade. Always check the Terms and Privacy policy to understand how the platform operates.
How to Refine Your Technical Analysis Skills
Refining your skills is a continuous process. Start by focusing on one or two indicators rather than cluttering your chart with too many. Over-analysis can lead to confusion. Once you have a basic strategy, test it consistently. If you are starting with limited funds, read How to Start Binary Options Trading with Small Capital for practical tips on managing your account. Additionally, be aware of Common Mistakes in Binary Options Trading: A Guide for Beginners to avoid pitfalls that many new traders encounter. The 2x option platform also offers a 10-level Rewards program that provides bonuses based on your turnover. When you are ready to move from virtual funds to real trading, you can easily Deposit using card or crypto options. If you ever need to access your funds, the Withdraw process is straightforward, though it involves manual review and identity verification for security purposes.
Staying Disciplined in Your Trading Journey
Technical analysis is only one part of the equation; discipline is the other. Even with the best charts, market conditions can change rapidly. The platform provides optional AI trading assistants—Emo, Timo, and Bimo—which are clearly labeled as AI and do not guarantee results. Use these as supplementary tools rather than relying on them for decision-making. Always keep your emotions in check and stick to your pre-defined plan. Whether you are analyzing OTC synthetic markets or crypto, consistency is key. If you find yourself struggling, revisit the Help section or use the AI assistant for guidance. By maintaining a structured approach and continuously educating yourself, you can improve your ability to read charts effectively. Try the Demo account to begin your journey today.
Practice with virtual funds before risking real money.
Try the Demo accountFAQ
Sources
Risk warning: Trading carries a high level of risk. You may lose all your capital. 18+ only. Not financial advice. Availability depends on your country.
Spotted a mistake? Tell us and we will correct it.